Grafana Overview
Metrics graphs provide both live and longer term summary information about your account usage. They can be used to see the total number of devices that have requested Approov tokens over a time period (and therefore what the usage related costs will be) and also show the failures where particular devices have been denied valid Approov tokens. The graphs provide information about the reasons for any such failures.
There are two ways that you can reach the metrics graphs:
(1) Directly via the link that may have been provided in your onboarding email.
(2) The metrics portal can also be reached via an approov command. This automatically opens the metrics information in your browser:
approov metrics
The URL being opened is shown in the command line and a new browser window is opened with the relevant information. If the browser does not open for some reason (perhaps because there is no default browser is setup) then the given URL can be pasted in another browser window to view the information.
Note that the browser request or onboarding link contains an access token to authorize viewing of the information. Since this is pasted into a browser, it should be handled with care. It is a specially constructed token that provides read-only access to the metrics information and no other aspects of the account. If you are ever concerned that this link may have been compromised then you can use the command approov monitoring -refreshMetricsLink and all previous links will be revoked and a new one generated. Note that this same link is shared between all users of the account.
Grafana
The metrics graphs are rendered using Grafana. Please refer to Grafana Getting Started to understand how to use the basic features of Grafana. Note that you will be provided with a fixed set of dashboards showing information from your account and you will not be able to edit these dashboards or add new data sources.
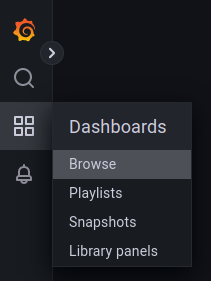
A number of different individual dashboards are available for your account, each showing different information and described in later sections. Each dashboard may contain a number of different graphs that show different types of activity from your account. The available dashboards can be listed using the menu on the top left hand side of the screen:
Graphs are rendered over a timescale defined in the text box at the top right of the screen. If you click on this then various timescale options are provided. Moreover you can click the refresh button to the right of this to cause to show the latest data from the selected time range. Options for automatic refresh are also available. Note that times are always shown in UTC, regardless of your local timezone setting. The timescale settings impact all graphs shown on the same dashboard. It is possible to zoom into an area of interest in a graph using the mouse: click, drag and release to highlight and zoom into the region of interest.
Each graph shows a number of time series, depending upon the graph and the exact circumstances of your account. On many graphs there are numerous time series so it may be difficult to see an individual one. You can restrict the graph to only show a single time series by clicking on it in the legend on the right hand side of the graph. Clicking on it again enables all time series. You can use the Control key to perform a multi-select to show an arbitrary set of time series together.
The legend shows the maximum value in the time range being shown and for some graphs an average is also shown. Hovering over the graph allows the values to be seen on each selected time series at an arbitrary time.
The authentication method used for Approov Grafana dashboards complicates the use of the "Share" options. If you wish to share dashboards you must make sure that the user has first stored the credentials cookie in the browser before clicking on a link generated by Grafana. You can do this by also sharing the URL generated by the approov metrics command, or the one present in your onboarding email. If you ask the recipient of the shared links to click on the Approov generated authorization link before using the shared dashboard link the pages will then work as expected.
The graphs provide access to a Configuration button which lists available Plugins. Note that these are not available for use in your account.
Grafana Dashboards
Different collections of metrics are presented by different Grafana dashboards with each one presenting related data on a single page. The dashboards collectively cover 3 different categories: Live Metrics, Summary Metrics, and Billing Usage. The list below describes the categories and the associated dashboards with links to sections that provide more details:
-
Live Metrics Dashboards. The Live metrics dashboards allow you to view the current activity in your account in near real time. The metrics are accumulated for a minute by the Approov backend service before the caluclated data points are added to the time-series database that holds the raw data behind the metrics views. After a short propagation delay the metrics will be viewable from the dashboards; in total a delay of less than 2 minutes.
Live metrics dashboards automatically accumulate data from multiple per-minute data points as the queried time range grows. For maximized browser windows displayed at typical modern resolutions, the default time-range of 1 hour will present the raw per-minute point values. As the time range grows the accumulation period will also grow to keep the total number of displayed points roughly consistent. For example, with a 3-hour time range the accumulation period will be 2 minutes meaning that each point displays the mean of two adjacent per-minute metric values. The titles of the individual graph panels in the live metrics dashboards all display the active Accumulation Period in use in that panel.
The data that backs the live metrics dashboards is kept for at least 14 days, although an absolute time range limit of 7 days is applied to any request. Requests for greater time ranges will be rejected to help prevent overloading the metrics server backend Similarly, requests that specify time ranges that include times outside the limit of stored data are also rejected. If this happens, the graph panels will be drawn blank but with a warning trinagle in the top left corner. Clicking the triangle will display the available error information. If you would like to view longer time ranges, then we suggest that you use the summary metrics dashboards described below, identify the behavior of interest, and then use the live-metrics views to get more detailed insight within a smaller time range.
Four dashboards present live data:
- Live: Mobile App Attestations Presents metrics that describe the mobile app attestation activity and results. It includes metrics gathered from mobile apps of the following types: Mobile Result Overview, Mobile Device Properties, and unversioned Mobile App metrics.
- Live: Mobile App Version Activity Presents the attestation activity partitioned by different mobile app versions. It includes the versioned Mobile App metrics.
- Live: Mobile SDK Activity Presents the metrics captured on device and then reported by the mobile SDK as it contacts the primary service to perform an attestation. This dashboard includes Mobile SDK Metrics.
- Live: Web App Activity Presents the metrics that describe the activity of the Approov web protection integration and the 3rd party services that it calls. This dashboard includes Web Protection Metrics.
-
Summary Metrics Dashboards. The summary dashboards present account activity accumulated over different time periods. All the dashboards present Mobile Result Overview, Mobile Flag, unversioned Mobile App and Web Protection metrics.
Summary dashboards always present the data points at the raw summary data capture period of 1 hour; unlike live metrics, there is no accumulation period controlled by the Grafana layer. The side-effect of this is that if the time range is such that Grafana cannot display all points in the selected time range then it will elect to exclude certain points from the rendered graph. Be aware of this if you are looking at graphs that plot time ranges with more points than there are pixels across the display area. There is no explicit notification from Grafana when this has happened although the labels on the time axis should give you some hint. You can also tell by hovering the mouse over adjacent points in the graph; hovering the mouse over a point will cause a pop-up to be displayed which includes the associated time.
The data that backs the summary metrics dahsboards (and also billing usage) is kept for at least 3 months. No access to metrics data is available outside this period. When viewing summary metrics, you can request a time range up to 3 months. Larger time ranges, or ranges that include periods beyond the range of recorded data, may be rejected by the metrics server backend resulting in blank graphs with a warning triangle in the top left corner. Clicking the triangle will display the available error information.
Three dashboards (and the separate Billing Usage dashboard) present summary data:
- Summary: Hourly Activity Summary metrics allowing assessment of the counts of different devices or web protection requests from hour to hour.
- Summary: Daily Activity Summary metrics allowing assessment of the counts of different devices or web protection requests from day to day.
- Summary: Monthly Activity Summary metrics allowing assessment of the counts of different devices or web protection requests from month to month.
-
Billing Usage. This is a single dashboard category. It presents the metrics that summarise billable activity in your account. The presented metrics are a subset of the monthly summary metrics and the same time range and boundary restrictions apply.
Live: Mobile App Attestations
The Live: Mobile App Attestations dashboard reports on mobile app attestation success and failure with the associated causes in your account. It also presents the result of any device filters you have configured. Information shown in the graphs is updated within 2 minutes of the event occurring. New accumulated data is recorded and viewable every minute. The following image shows the central section of the dashboard:
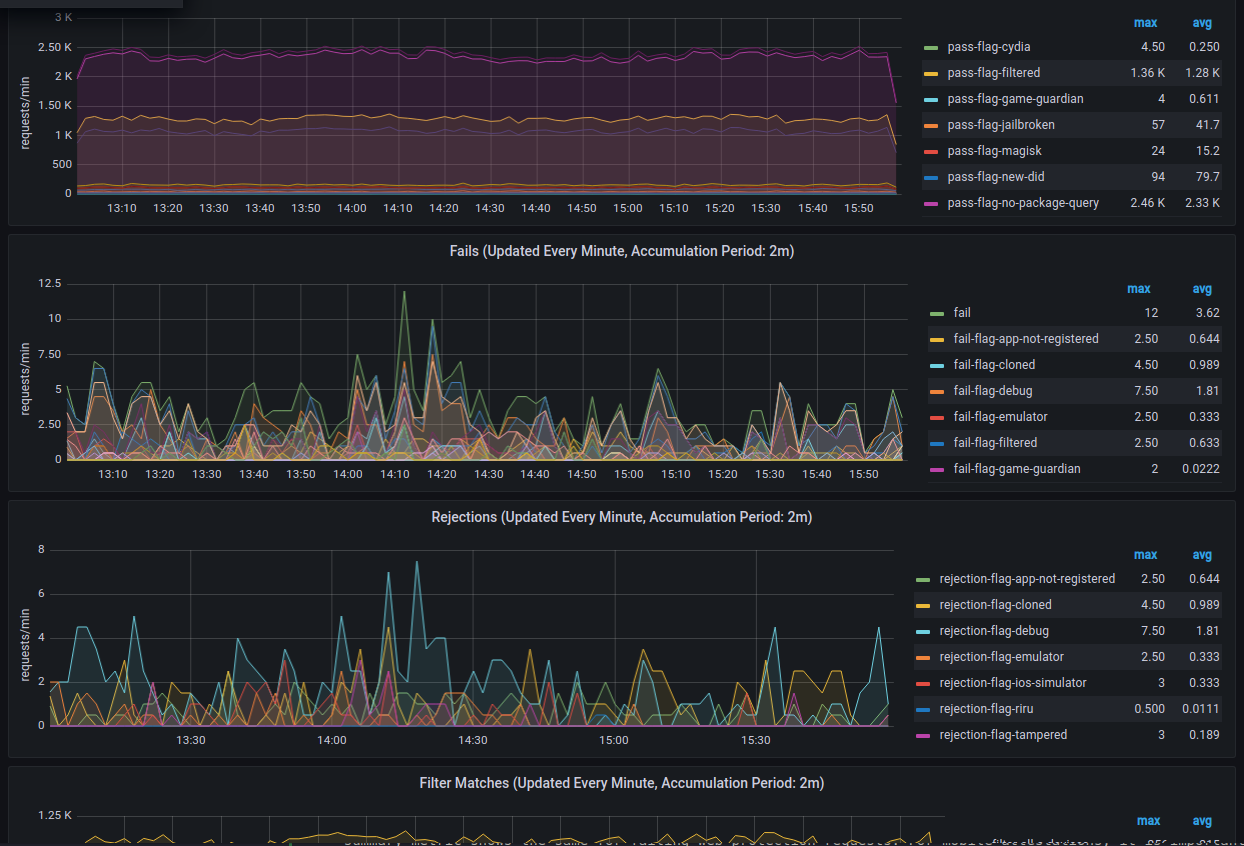
The metrics are shown across four graphs:
- Passes: This shows Mobile Result Overview, Mobile Device Properties, and unversioned Mobile App metrics from requests that pass and for which a valid Approov token was issued. Metrics are prefixed with
pass-indicating this status. Thepassmetric shows the total number of mobile app attestation passes. - Fails: This shows Mobile Result Overview, Mobile Device Properties, and unversioned Mobile App metrics from requests that fail and for which an invalid Approov token was issued. Metrics are prefixed with
fail-indicating this status. They may be prefixedfail-dev-if the failure is related to a development build that is failing. Thefailmetric shows the total number of mobile app attestation failures. It is important to understand that this shows the properties of the failing device, but these are not necessarily the properties that caused it to fail. Those are shown in the Rejections graph. - Rejections: Shows the Mobile Device Properties Metrics that caused attestation failures. In this graph, the device properties that caused the failures have their
fail-prefix changed to arejection-prefix to indicate this status. The prefixrejection-dev-is used to mark reasons for rejections in development builds. This graph also shows the Mobile Rejection Policy Metric which is being applied. - Filter Matches: Shows the Mobile Device Filter Metrics for any matches being made because of defined Device Filters.
- Security Rules Versions: Shows which particular security rules version is being used. This helps correlate changes in rejection patterns on the account to changes to the security rule version being used, see Security Rules Version Management.
The y axis for the graphs are in terms of the volume of requests (requests per minute). The same device making multiple requests within a time period will be counted multiple times.
During initial development, when there is data coming from a very low number of devices, this dashboard provides the quickest way to determine if requests are reaching the Approov servers and evaluating the responses that are made.
Live: Mobile App Version Activity
The Live: Mobile App Version Activity dashboard reports on attestation success and failure results across the different versions of apps you have deployed. Note that the version specific activity of apps with Temporary Registrations are not recorded, although all other metrics from those apps are gathered as normal. Information shown in the graphs is updated within 2 minutes of the event occurring. New accumulated data is recorded and viewable every minute.
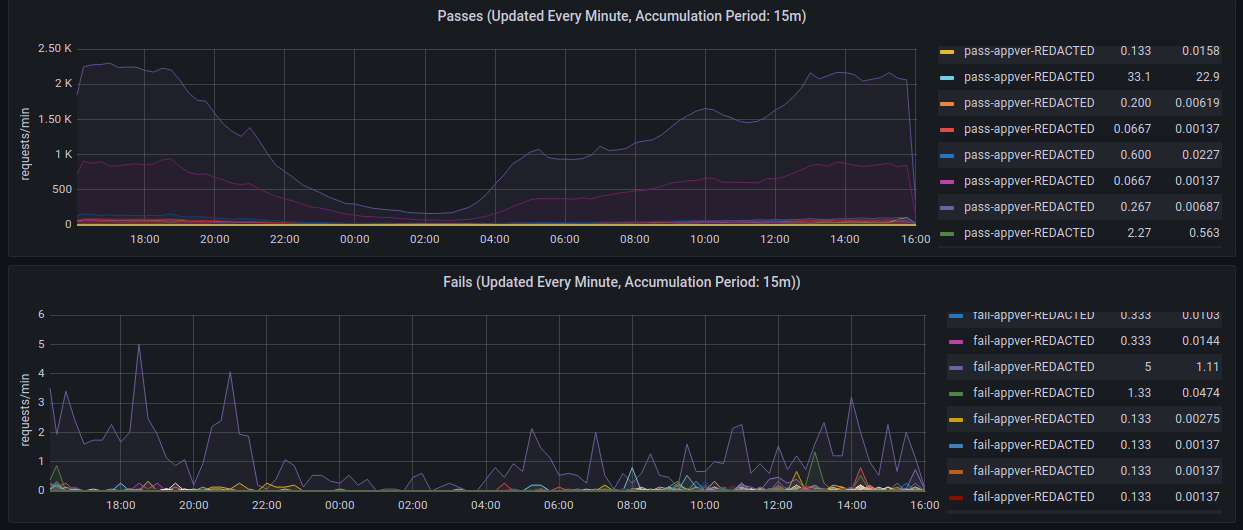
The metrics are shown across two graphs:
- Passes: This shows versioned Mobile App metrics from requests that pass and for which a valid Approov token was issued. Metrics are prefixed with
pass-indicating this status. - Fails: This shows versioned Mobile App metrics from requests that fail and for which an invalid Approov token was issued. Metrics are prefixed with
fail-indicating this status.
The y axis for the graphs are in terms of the volume of requests (requests per minute). The same device making multiple requests in a time period will be counted multiple times.
Live: Mobile SDK Activity
This dashboard shows live Mobile SDK metrics that are being collated from running Approov SDKs in apps associated with the account. These are aggregated across all SDKs with a new sample being generated every minute. These metrics are not directly associated with a pass or fail.
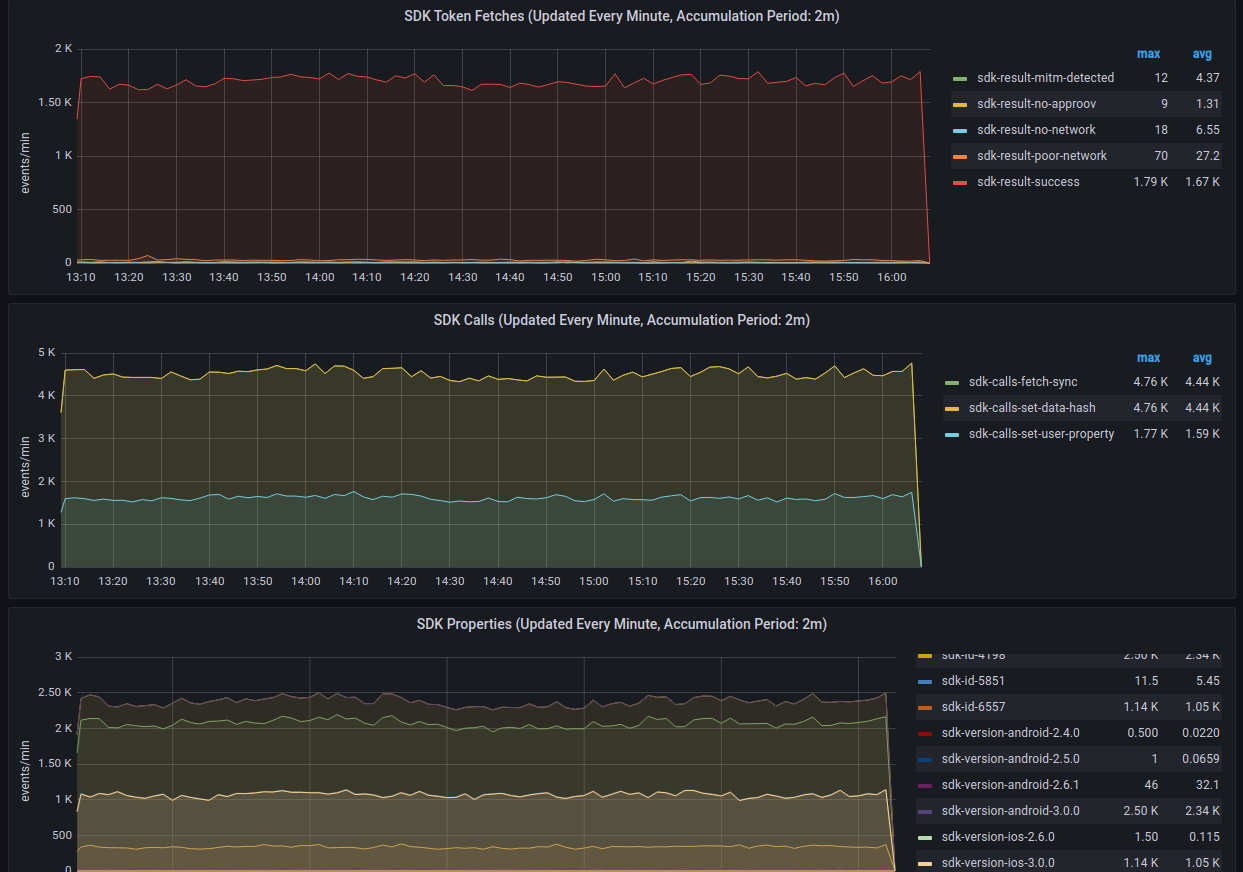
The metrics are shown across three graphs:
- SDK Fetches: Shows the
sdk-resultmetrics. These are helpful to determine if there are any widespread issues affecting running SDKs. The vertical scale is of succeeding or attempted fetches. Note that if a particular SDK instance is without network for an extended period while trying to perform fetches then when it reconnects the count of attempts made is associated with that connection time, which may cause a spike in the graph forsdk-result-no-networkorsdk-result-poor-networkresults. - SDK Calls: Shows the
sdk-callsmetrics. These are related to counted calls made in the SDK, and will typically be larger than the number of actual Approov fetches. For instance, calls to get an Approov token when one is already cached are counted here. - SDK Libraries: Shows the
sdk-archandsdk-idmetrics. This shows the particular architectures and library IDs that are in use. - Service Layers: Shows the
sdk-approov-servicemetrics. This shows which particular type of service layer framework is being used with the account.
Live: Web App Activity
The Live: Web App Activity dashboard reports on web app attestation success and failure and the associated causes in your account.Information shown in the graphs is updated within 2 minutes of the event occurring. New accumulated data is recorded and viewable every minute.
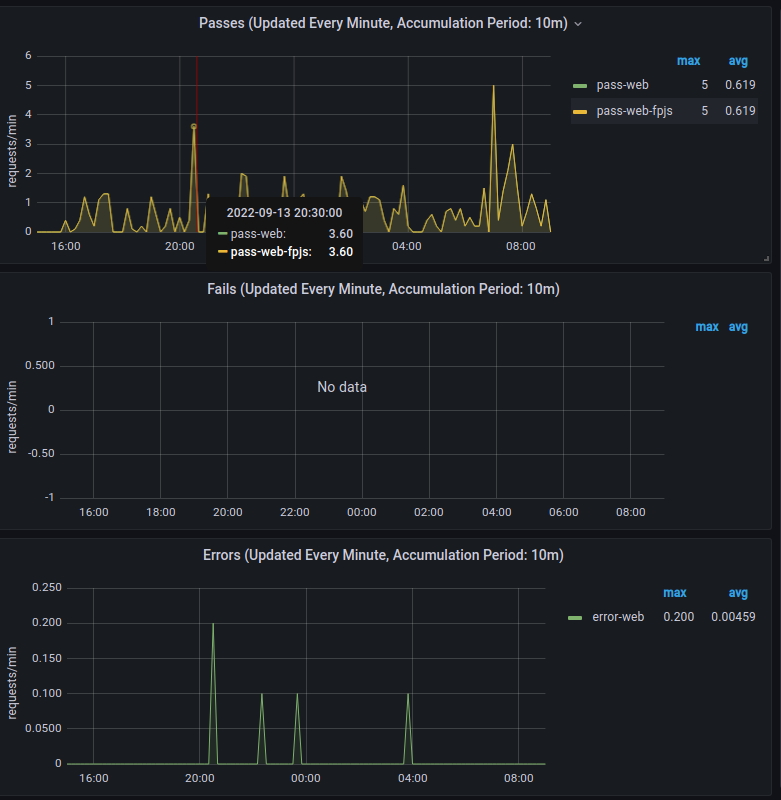
The metrics are shown across three graphs:
- Passes: This shows Web Protection metrics from requests that pass and for which a valid Approov token was issued. Metrics are prefixed with
pass-web-indicating this status. Thepass-webmetric shows the total number of web protection passes across all integrated web protections. - Fails: This shows Web Protection metrics from requests that fail and for which an invalid Approov token was issued. Metrics are prefixed with
fail-web-indicating this status. Thefail-webmetric shows the total number of web protection fails across all integrated web protections. - Errors: This shows occurences of the
error-webmetric listed with the other Web Protection metrics. It is caused by requests for web protection that resulted in an error response. There is no record of the type of error in the graph but this information is sent back to the browser making the request. See the section on Troubleshooting Web Protection Errors to get more pointers on diagnosing and fixing these errors.
The y axis for the graphs are in terms of the volume of requests (requests per minute). The same browser making multiple requests in a time period will be counted multiple times.
During initial development, when there are no deployed web apps also providing data, the graph can be used for quickly determining if requests are reaching the Approov servers and assessing the response made.
Summary: Hourly Activity
This dashboard provides an overview of the hourly usage of the account in terms of the number of different device IDs that used the account in an hour period and the total number of mobile app attestation and web protection requests that were made. A new sample is output every hour. It shows Mobile Result Overview, Mobile Device Properties, Mobile App and Web Protection metrics. This allows assessment on the level of account usage from hour to hour in terms of the count of different devices or mobile attestation and web protection requests. The upper two graphs show device related metrics and the lower two show request metrics.
Device Metrics
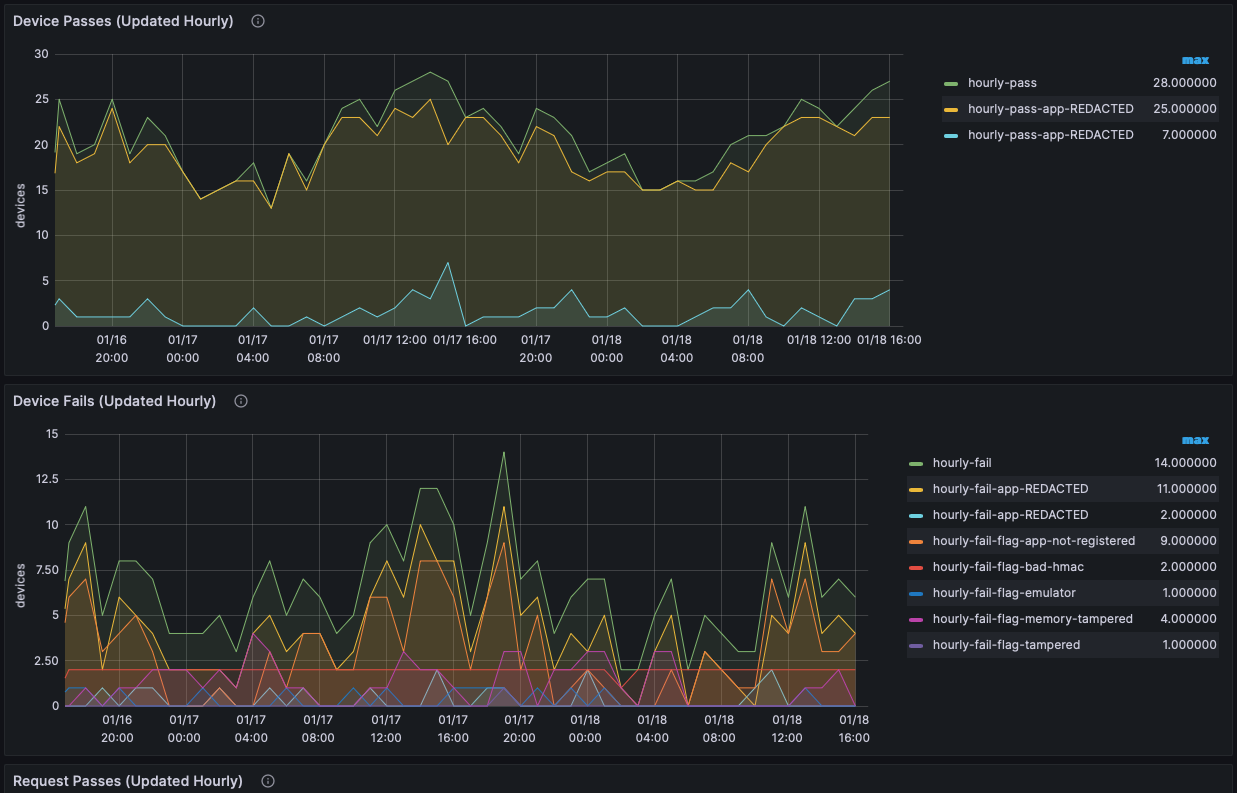
Note that this dashboard will be blank if your account is using metered-only billing.
The upper graph shows devices that passed in the last hour and were therefore issued with at least one valid Approov token. The metrics are prefixed with hourly-pass. Pass metrics are restricted to a total and per-app package breakdown.
The lower graph shows the devices that failed in the last hour and were therefore issued with at least one invalid Approov token. The metrics are prefixed with hourly-fail. Fail metrics also show the flags that caused failures (i.e. those shown with the rejection- prefix in the Live: Mobile App Attestations dashboard).
Note that if a device both passes and fails in the same day then it will be counted in both graphs.
Request Metrics
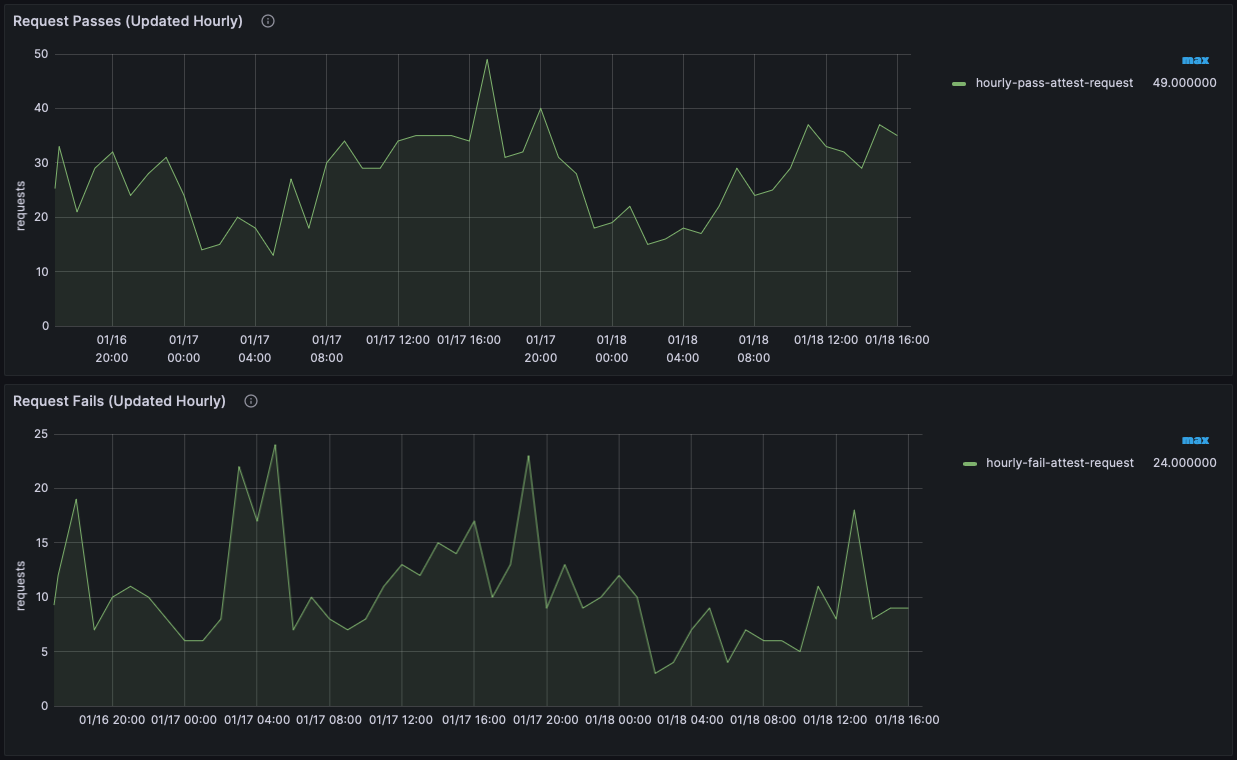
The upper graph shows the mobile attestation and web protection requests that passed in the last hour and therefore resulted in a valid Approov token. The metrics are prefixed with hourly-pass.
The lower graph shows the mobile attestation and web protection requests that failed in the last hour and therefore resulted in an invalid Approov token. The metrics are prefixed with hourly-fail.
Summary: Daily Activity
This dashboard provides an overview of the daily usage of the account. The number of devices as well as mobile attestation and web protection requests are counted throughout the day, until reset at midnight UTC. A new sample is output every hour. It shows Mobile Result Overview, Mobile Device Properties, Mobile App and Web Protection metrics. This allows assessment on the level of account usage from day to day in terms of the count of different devices or mobile attestation and web protection requests. The upper two graphs show device related metrics and the lower two show request metrics.
Device Metrics
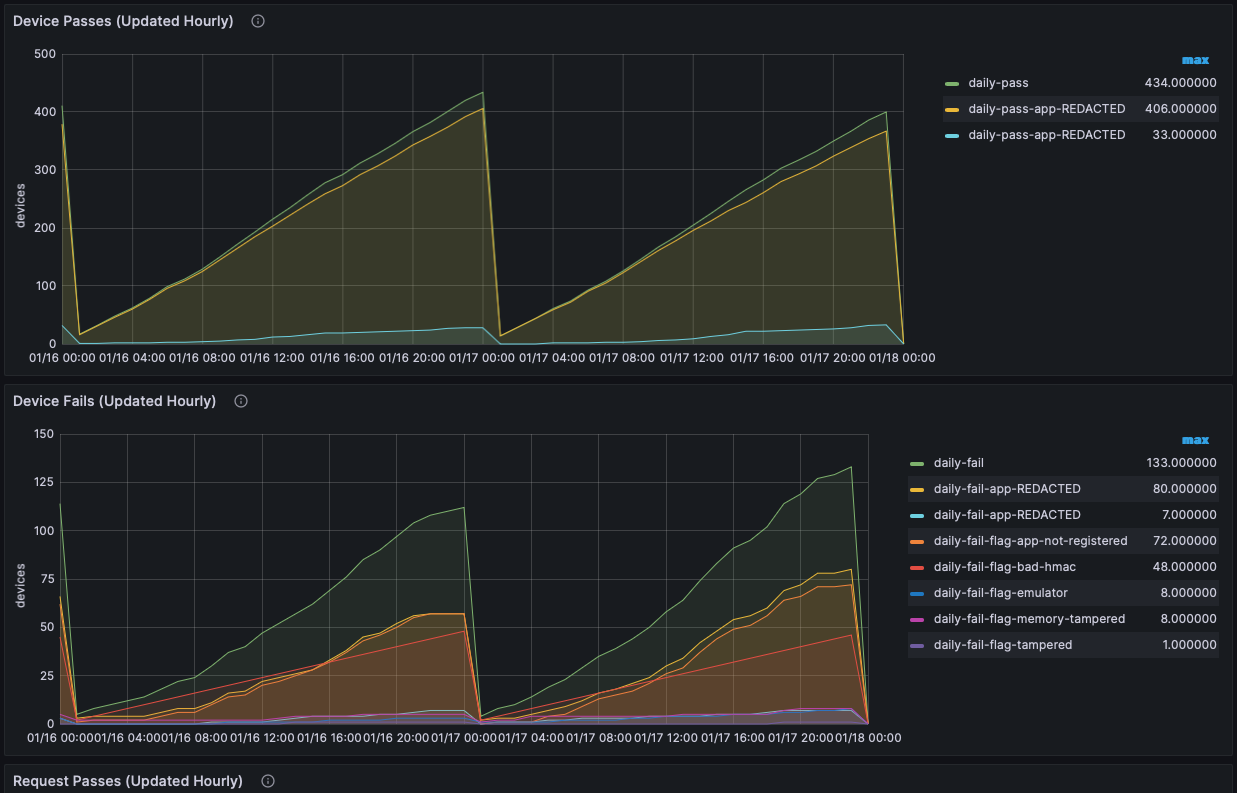
Note that this dashboard will be blank if your account is using metered-only billing.
The upper graph shows devices that passed in the last day and were therefore issued with at least one valid Approov token. The metrics are prefixed with daily-pass. Pass metrics are restricted to a total and per-app package breakdown.
The lower graph shows the devices that failed in the last day and were therefore issued with at least one invalid Approov token. The metrics are prefixed with daily-fail. Fail metrics also show the flags that caused failures (i.e. those shown with the rejection- prefix in the Live: Mobile App Attestations dashboard).
Note that if a device both passes and fails in the same day then it will be counted in both graphs.
Request Metrics
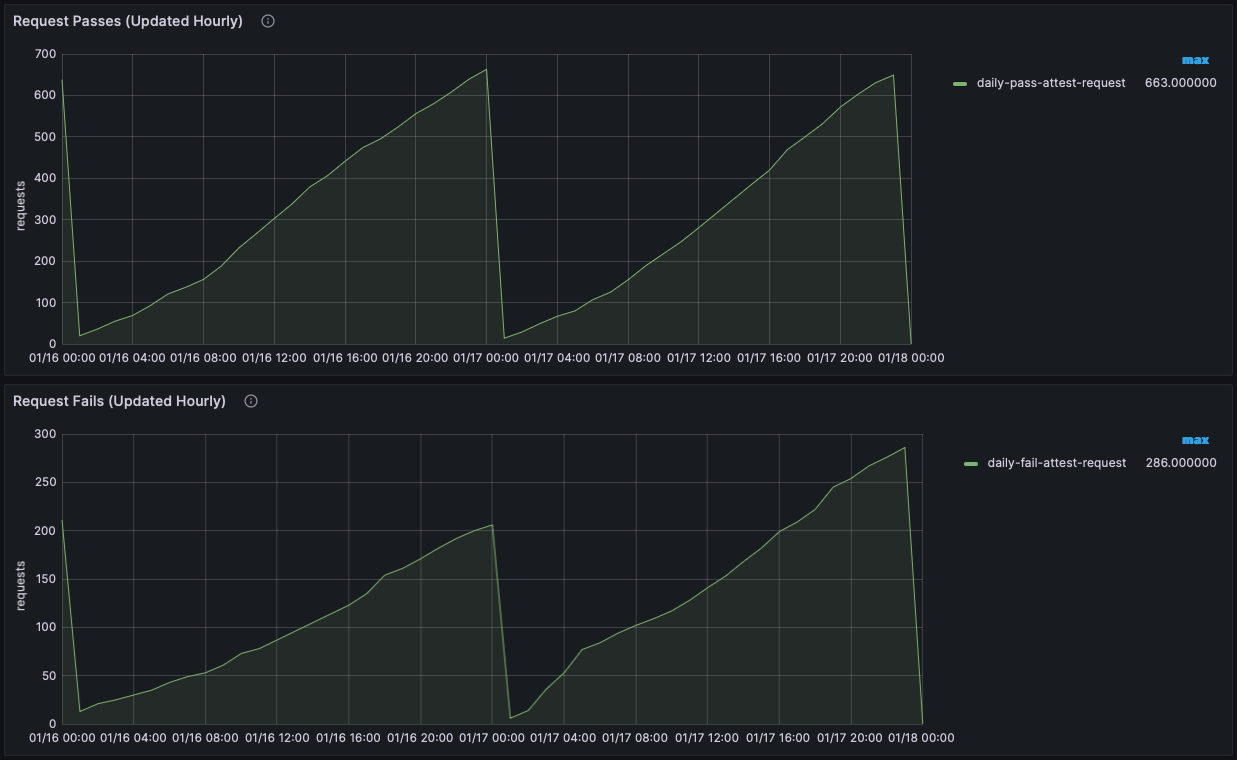
The upper graph shows the mobile attestation and web protection requests that passed in the last day and therefore resulted in a valid Approov token. The metrics are prefixed with daily-pass.
The lower graph shows the mobile attestation and web protection requests that failed in the last day and therefore resulted in an invalid Approov token. The metrics are prefixed with daily-fail.
Summary: Monthly Activity
This dashboard provides an overview of the monthly usage of the account. The number of devices as well as mobile attestation and web protection requests are counted throughout the month, until reset at midnight UTC on the billing day of the account. A new sample is output every hour. It shows Mobile Result Overview, Mobile Device Properties, Mobile App and Web Protection metrics. The upper two graphs show device related metrics and the lower two show request metrics.
Device Metrics
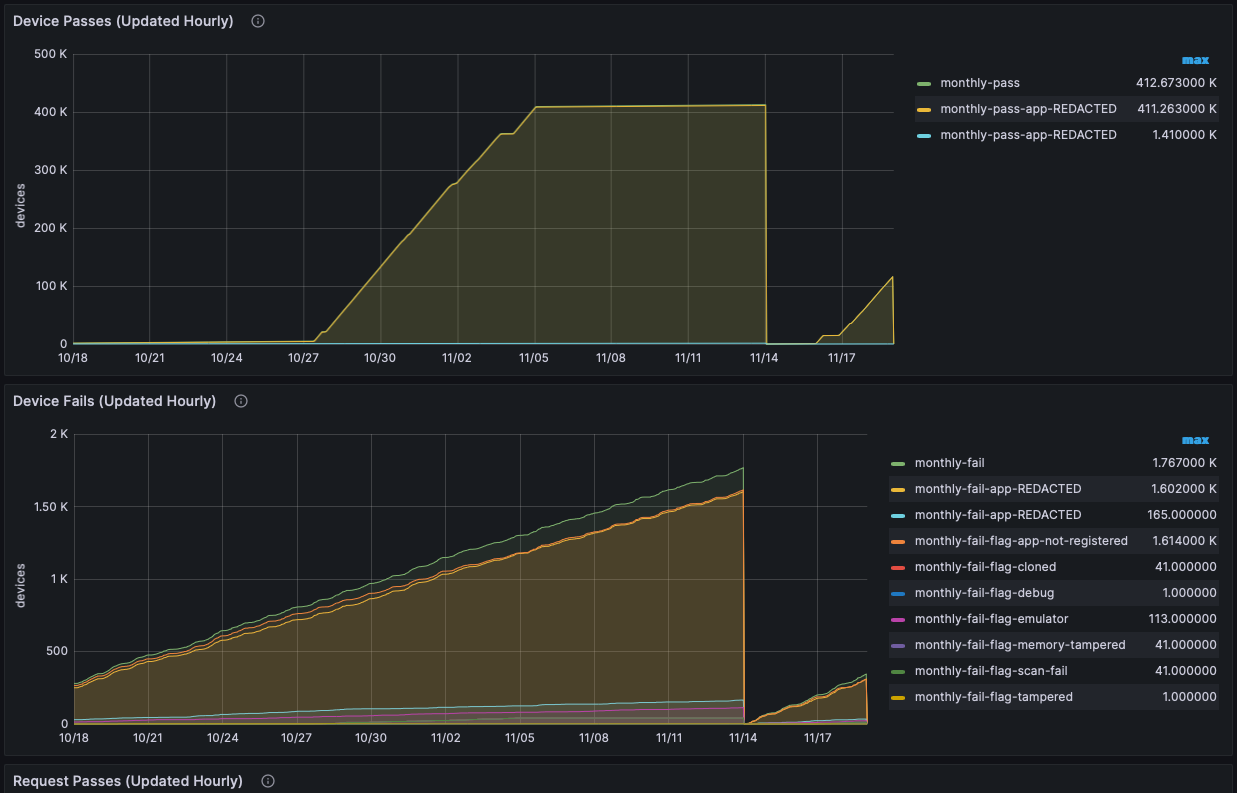
Note that this dashboard will be blank if your account is using metered-only billing.
The upper graph shows devices that passed in the last month and were therefore issued with at least one valid Approov token. The metrics are prefixed with monthly-pass. Pass metrics are restricted to a total and per-app package breakdown.
The lower graph shows the devices that failed in the last month and were therefore issued with at least one invalid Approov token. The metrics are prefixed with monthly-fail. Fail metrics also show the flags that caused failures (i.e. those shown with the rejection- prefix in the Live: Mobile App Attestations dashboard).
Note that if a device both passes and fails in the same month then it will be counted in both graphs.
Request Metrics
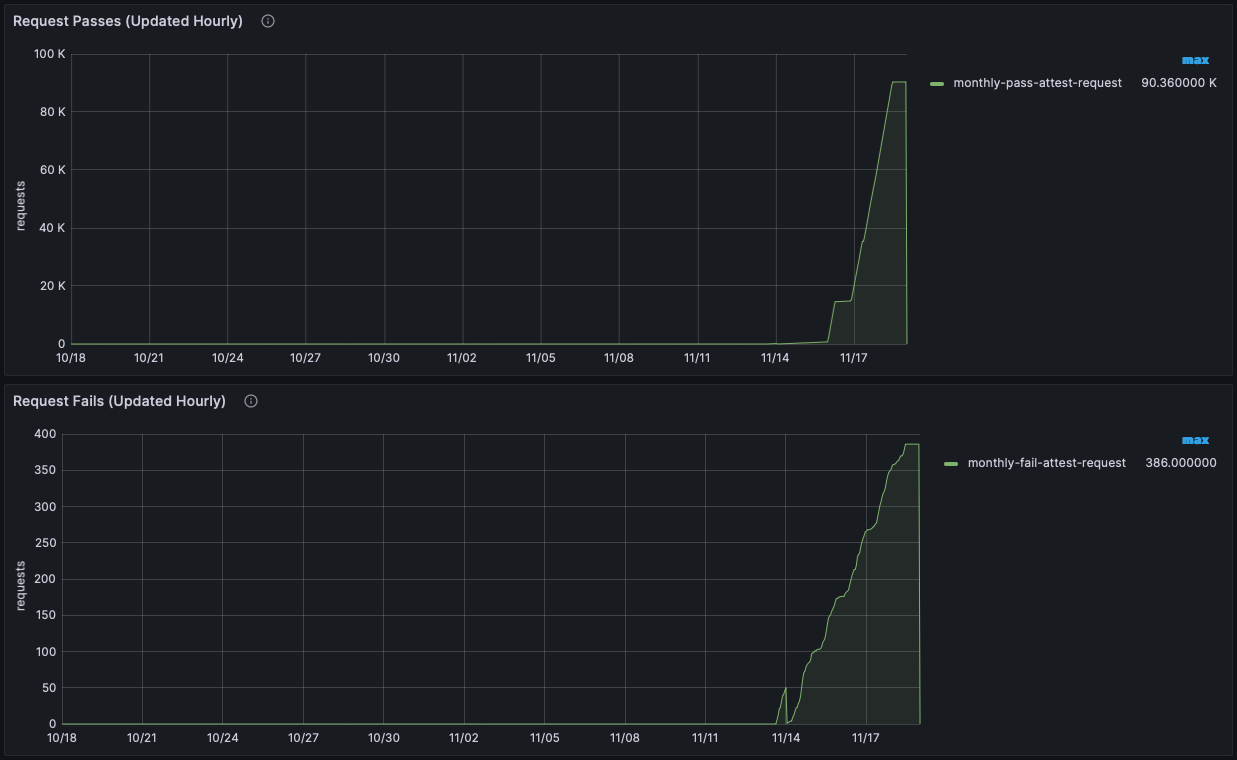
The upper graph shows the mobile attestation and web protection requests that passed in the last month and therefore resulted in a valid Approov token. The metrics are prefixed with monthly-pass.
The lower graph shows the mobile attestation and web protection requests that failed in the last month and therefore resulted in an invalid Approov token. The metrics are prefixed with monthly-fail.
Billing Usage
This dashboard provides an overview of the usage of an account over time showing Mobile Result Overview Pass and non-versioned Mobile App metrics. A new entry is generated on each hour. For mobile attestation billing, the y axis scale is based on the number of unique device IDs that have been seen since the start of your account's billing period in the month. For web protection integrations, the y axis shows the accumulated number of web protection requests resulting in valid Approov tokens.
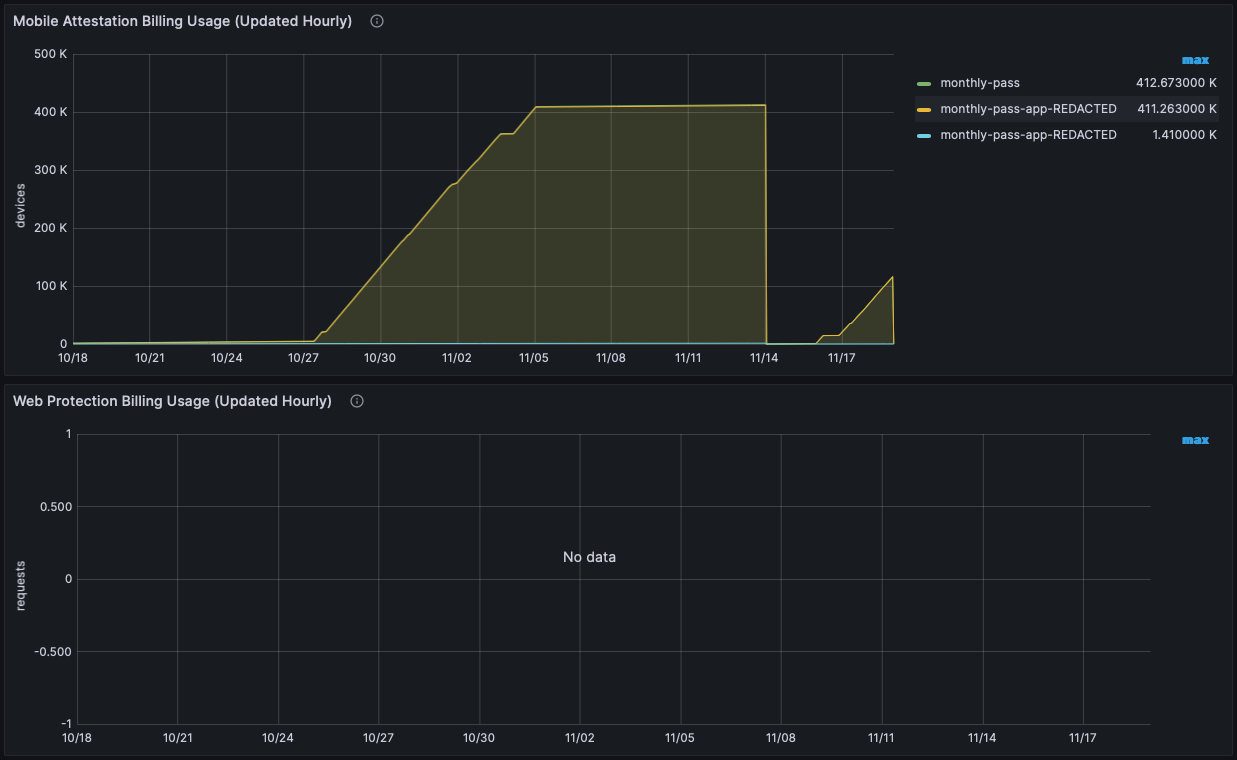
This figure will grow over the month until it is reset on the "billing day" anniversary each month. The maximum value that the monthly-pass and monthly-pass-web figures reach during the month is used to calculate the account's usage invoice for the month. Since billing is calculated only on the basis of passing attestation and web protection requests all metrics shown are in fact prefixed monthly-pass.
In addition to the overall figure, mobile app attestation metrics are also provided for each app package name that has been successfully used on the account. This allows an assessment to be made between iOS and Android usage, or for different apps associated with the account.
Note that this dashboard will be blank if your account is using metered-only billing.
The lower graph shows information about any usage of the Web Protection Integration.
Exporting Data
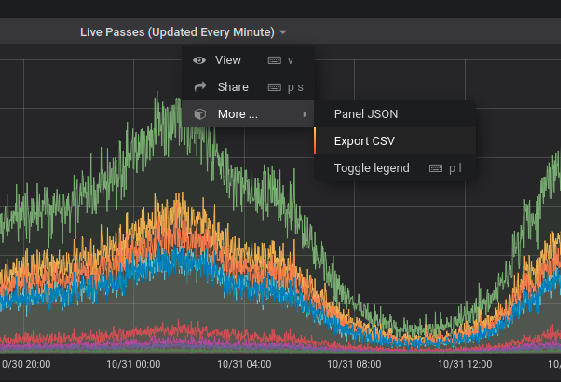
It is possible to export raw graph data into a CSV file using the menu available on the right click button on each graph, as follows: